Contents
We gather Data
You first have to gather data and organise it before you analyze it. Therefore, you must know the purpose you are gathering data to answer question in the real world.
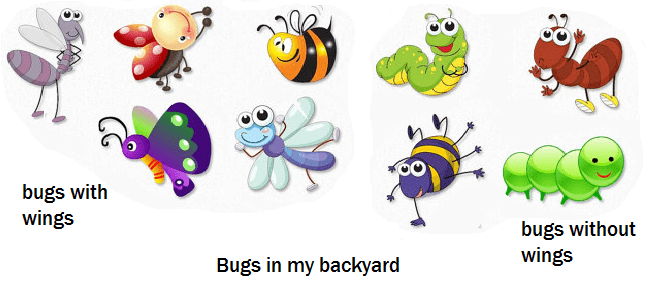
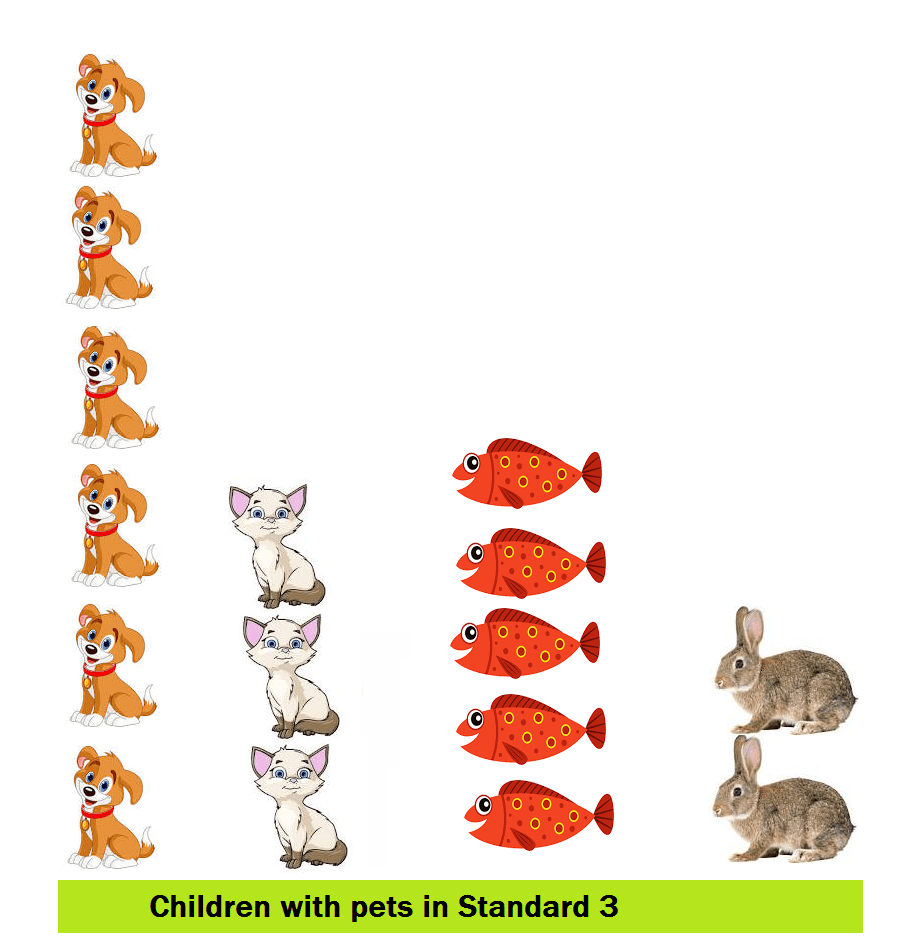
CLUSTER GRAPHS
Is a representation of two or more labeled loops.
Example:
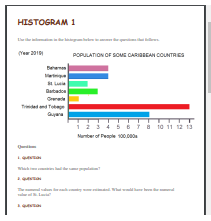
BAR GRAPHS AND TALLY CHARTS
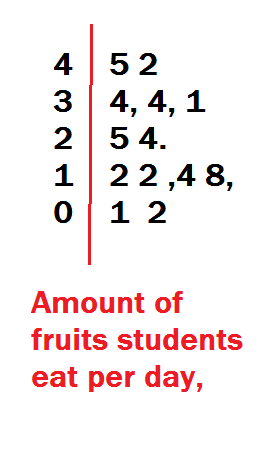
STEM AND LEAF PLOTS
CONTINUOUS DATA
When data is group along a continuous scale, they should be ordered along a number line.
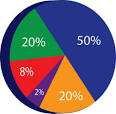
CIRCLE GRAPHS
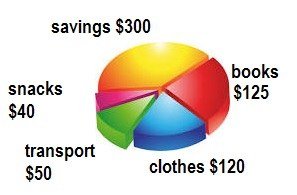
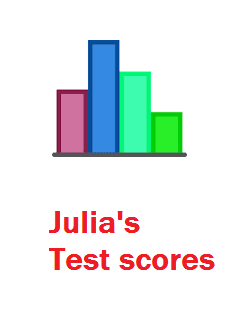
BAR GRAPHS
The information on a tally chart can also be represented on a bar graph.
Bar graphs are very useful as it gives you a visual representation of data. It allows you to compare data collected. It is quite easy to construct your own bar graph. Below show a bar graph showing a title (My Savings), the labels along the graph showing what the data is about, the scale showing the numbering, and the bars that shows the height.

Consider: What do you think this bar graph is telling you?
Worksheets
Click on the links below to download the PDF worksheets.


Click here for more worksheets.